ControlByWeb SNMP Monitoring and Zabbix MIB Import/Configuration
I set this up a while back and had to come back to it recently and realized I’d completely forgotten how I did it initially, so I thought I’d write a post.
The use case is that I’m using a ControlByWeb PLC…well ok, back up. For those not in the know (as I was until recently, thanks AvE!), a PLC is a Programmable Logic Controller and if you need to do any sort of environmental monitoring or interaction with systems, they are absolutely the bees knees. They come from a variety of vendors and in many form-factors, but the nice thing about the ControlByWeb products is that they are not terribly expensive, use standard TCP/IP (other ones use some weird form of “ethernet” networking…I put ethernet in quotes because they call it ethernet, but it’s not TCP/IP) and they have a web front-end built right into them (some others require a secondary or tertiary device for web front-end). Just for the record, I don’t make any money off of this blog and have no affiliation with ControlByWeb other than having purchased a few of their PLCs and sensors.
Back to the use case. My dad maintains the boiler at our church and I thought I’d help out with some alerting and interaction so that he doesn’t have to manually check it every day and will get some notifications if certain things happen (boiler won’t start, runs out of water, etc.). We installed an X410 PLC which can be powered by PoE and gives us a variety of I/O options (digital inputs, relays, temperature/humidity sensors, and more) and got to work building some rules to alert when certain conditions were met. The problem came when we started thinking about how to set up these alerts. This boiler is set up as an always-on boiler (it’s also steam), so the boiler always maintains a certain amount of steam pressure within itself, whether or not any thermostat is calling for heat. This makes it difficult because we can’t just write a rule that says “If the thermostat is calling for heat but the boiler doesn’t fire then alert us” because sometimes the boiler will not fire right away if it’s already hot enough to take care of the load. Anyway, long story short, we needed to do some trending and longer-term analysis of various aspects of the system to understand what normal actually is.
Enter SNMP monitoring. As most of you folks in IT are aware, SNMP is a fantastic mechanism for monitoring the current state of many disparate devices from one single system. I’ve used a number of different SNMP monitoring solutions in the past (Cacti & PRTG are free ones, Solarwinds Orion (STAY AWAY!) and many other paid-for/enterprise solutions) but I found Zabbix a while back and it’s been pretty solid for me. I honestly couldn’t tell you why I landed on it when I did (it was over 7 years ago), but I’ve been using it since. It has it’s quirks (some of which are the reason for this post) but overall it’s been good.
So I set out to get my PLC data into Zabbix, and ultimately displayed using Grafana (if you’re not using Grafana, give it a look). ControlByWeb PLCs have a nice feature where you can generate a MIB on the fly and download it. I’m guessing this was required because the device is so versatile, it could have any number of different types of devices connected in a particular scenario. The trouble is, while Zabbix works really well with its Windows and Linux-based agents, it’s a little less straight-forward with SNMP. Now it’s not actually that difficult, but it does take a few more steps and that’s what I’m here to show (finally…this post is apparently turning into a memoir).
Zabbix is actually pretty SNMP friendly, you just have to install the SNMP libraries on the server that you’re running it on. I’m running it on Ubuntu and (from what I remember) it was basically just apt install snmpd snmp-mibs-downloader (the latter being a pile of well-known and generic MIBs to be used). If you need a little extra, Digital Ocean has a good write-up. They say that you have to comment out the “mibs :” in the /etc/snmp/snmp.conf file, but I haven’t done that and mine seems to work fine. I’m sure I’m doing it wrong though.
Once you’ve done that and restarted the Zabbix service, all of the standard MIBs will be available, and Zabbix actually has templates built-in to utilize those MIBs. It gets a little more interesting when you’ve got a custom MIB file that you need to use (ok, not really that bad). Unlike some of the other SNMP tools, Zabbix doesn’t have an “Upload MIB” section in it’s interface to upload and utilize custom or manufacturer-provided MIBs. This isn’t really that tough of an issue though, you can just copy the MIB into the /usr/share/snmp/mibs/ directory on your server and Bob’s your uncle.
This last step is where it gets a little fun though. I suppose if you were going to do this on a large scale, it would be intelligent to build one or more Templates within Zabbix to be able to assign for Discovery on these assets, but I’ve only got the one, so I just did it manually.
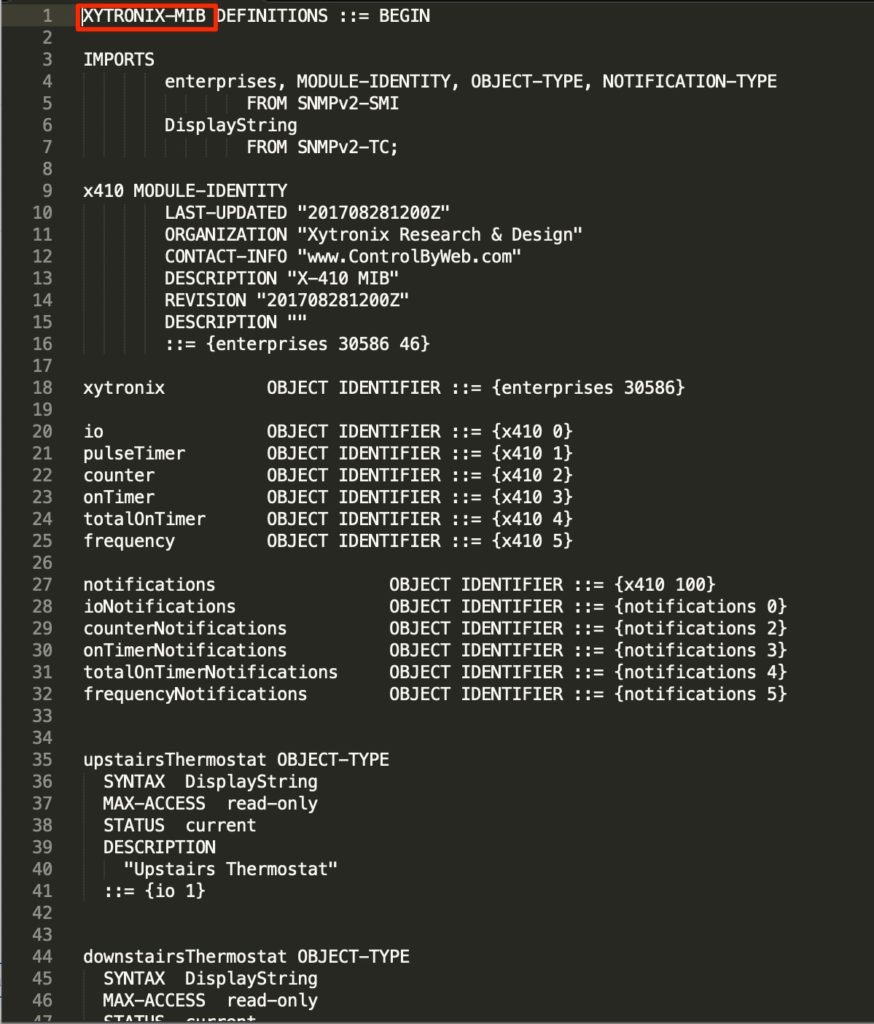
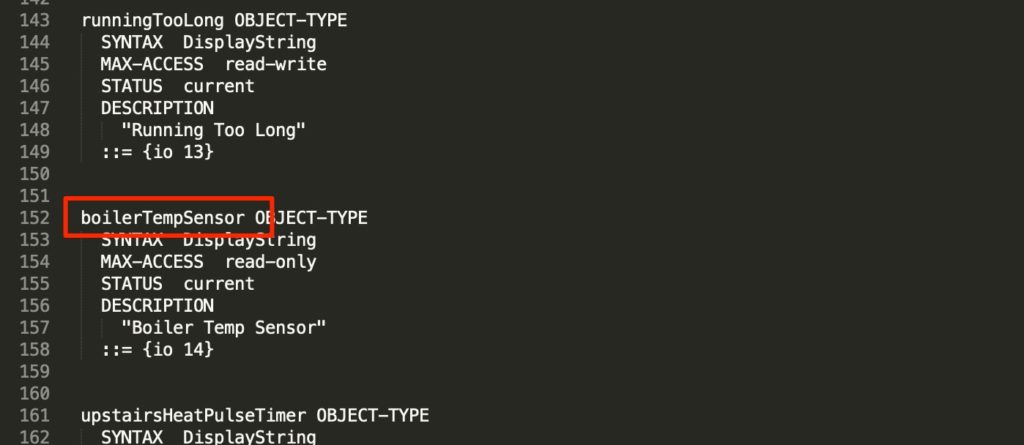
Creating new Items for a ControlByWeb device is relatively easy to do, you just need to take a look inside the MIB file. It took a little finagling at first, but once you know what to do it’s a cinch. If you take a look at the screenshots below, the first two are from the MIB (I cut most of it away because it would have been pretty long if I hadn’t).
Now take a look at the Item I created in Zabbix.
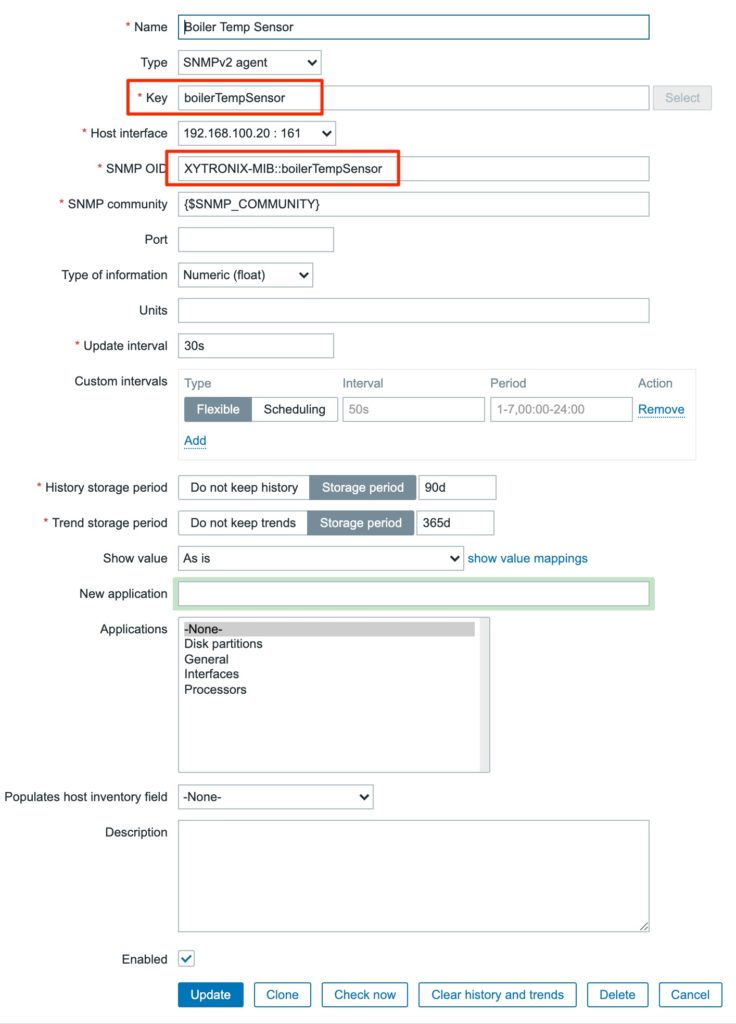
So once you get that far, it’s basically just grabbing the name of the MIB definitions from the top of the MIB file (you see in the first screenshot) and then using the device name created by the PLC as the rest of the OID (with the ‘::’ in-between of course). As far as I know, the ‘Key’ field is specifically for Zabbix’s database, but just to keep things simple I used the same value. One other thing that I found is that for numeric values I had to use the Numeric (float), the Numeric (unsigned) didn’t work.
NOTE: I found this out with the recent edit of the PLC configuration that I did, neither Zabbix, nor SNMPD like parenthesis in their MIB files. Massive explosions with happen! Ok, it will actually just fail to read, but it was still frustrating. ControlByWeb allows parenthesis in the naming of components within their interface, and then when you generate a MIB those parenthesis are included and Zabbix won’t read the MIB.
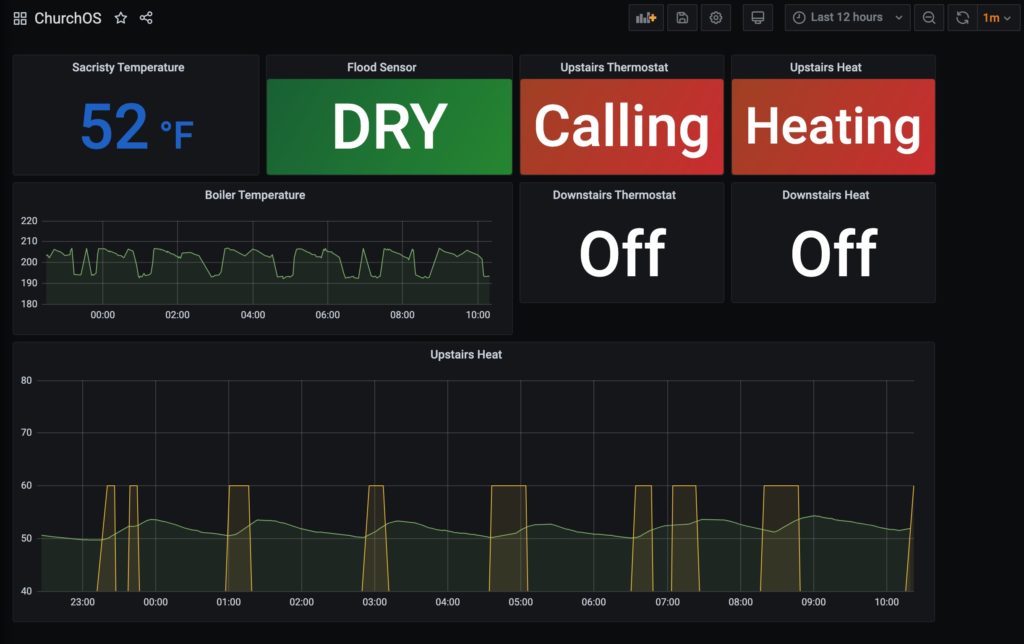
There, now all you have to do is stand up Grafana and connect it to Zabbix and you’ll be right on your way to making pretty dashboards like this one.
FYI, Zabbix has a huge repository of Official and end-user provided Templates that you can import directly into your Zabbix instance to provide automatic discovery and walking of different, well-known devices without needing to import a MIB or do anything like that. I’ve done this with my APC UPSs and PDUs and a few other things. You do have to resort to the MIB and using the mechanism above if you don’t find a shared Template for your device though (which is my case here, obviously). The link to the repository is https://share.zabbix.com/official-templates or you can just search it online and it’ll come right up.
(Update) If you’ve gotten this far, good on ya buddy and as a treat you get this. Apparently I’m a dunce and have written this post before….and subsequently forgot about it. My duncery is multiplied by the fact that I didn’t check my previous posts before spending the hour and a half writing, and subsequently publishing, this one. Well anyway, there’s a lot of really good MIB info in that post, so it’d actually be a good read in addition to this one (actually an even better read…less wordy). Here ya go! https://www.lukky.us/create-zabbix-host-items-from-mib/


Recent Comments